What I built
Screens below use demo data. Carriers, lanes and volumes are fictional.

Case study · Loblaw · 2026
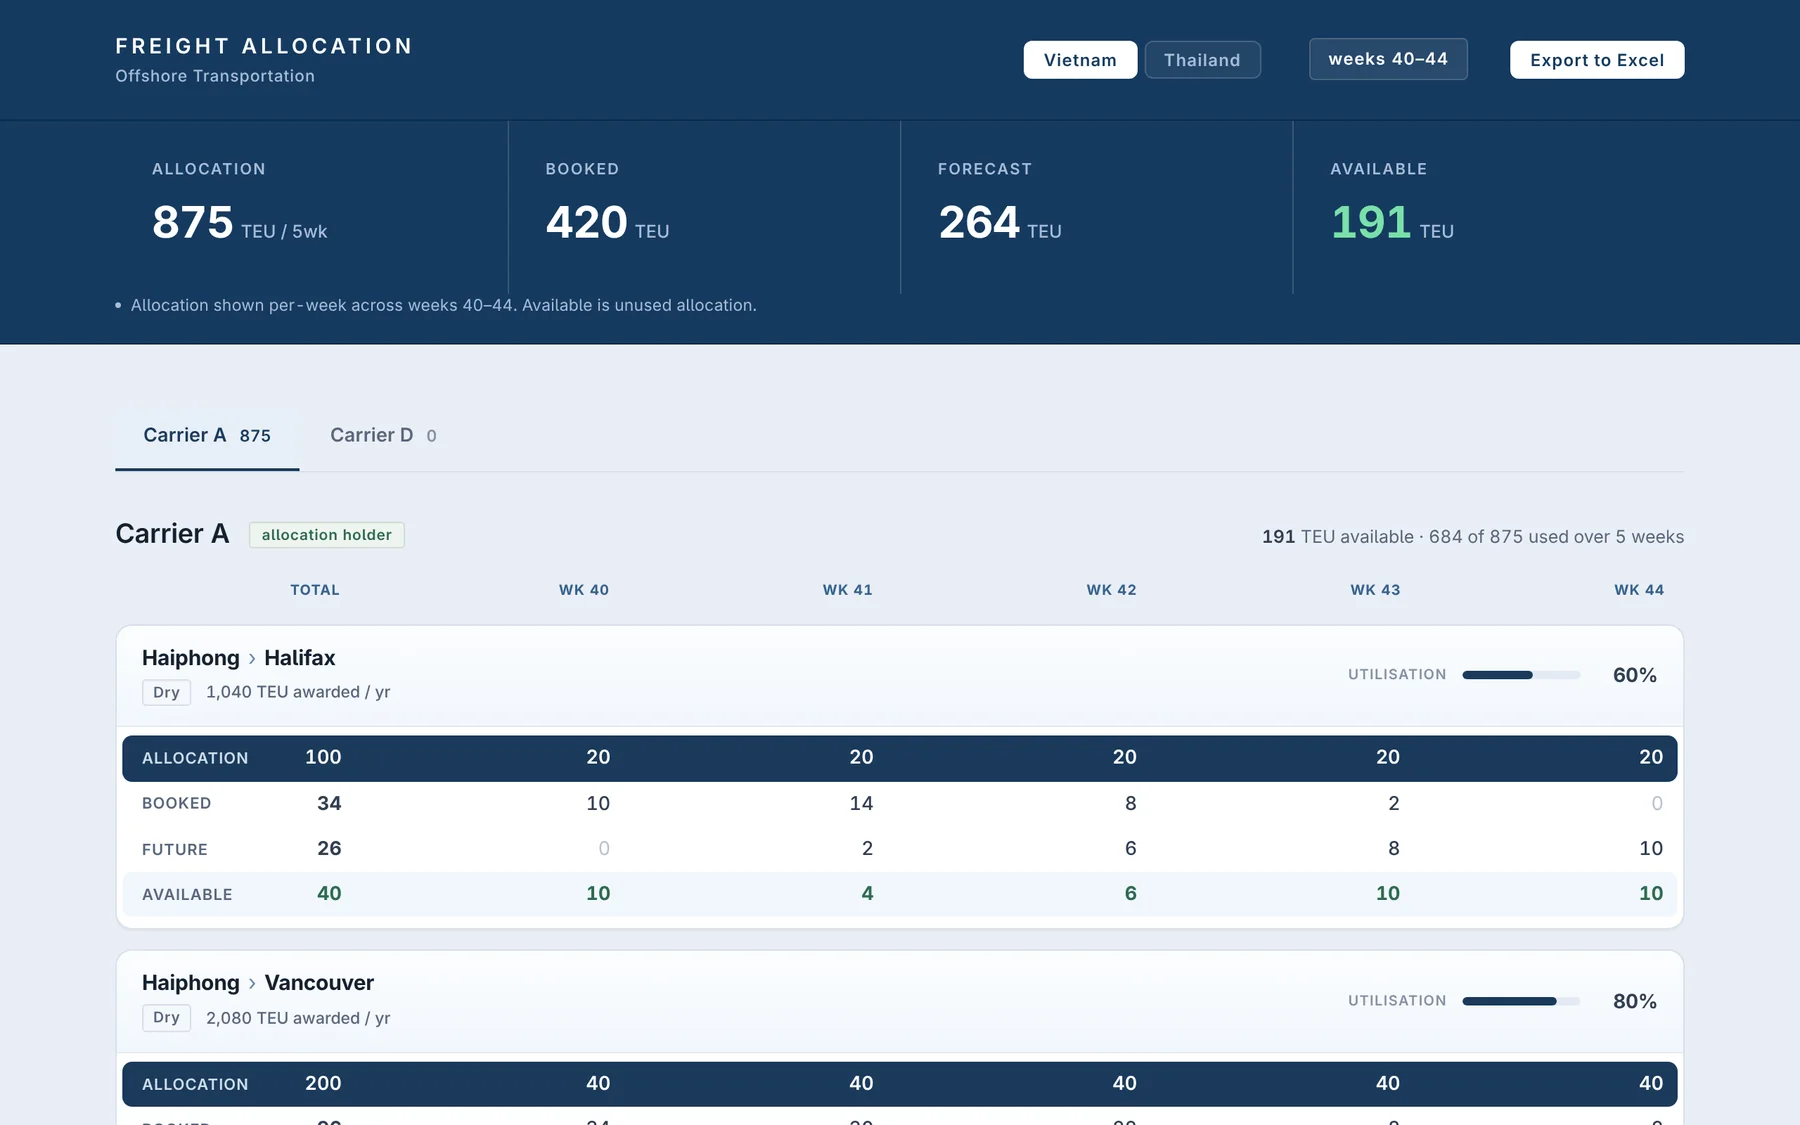
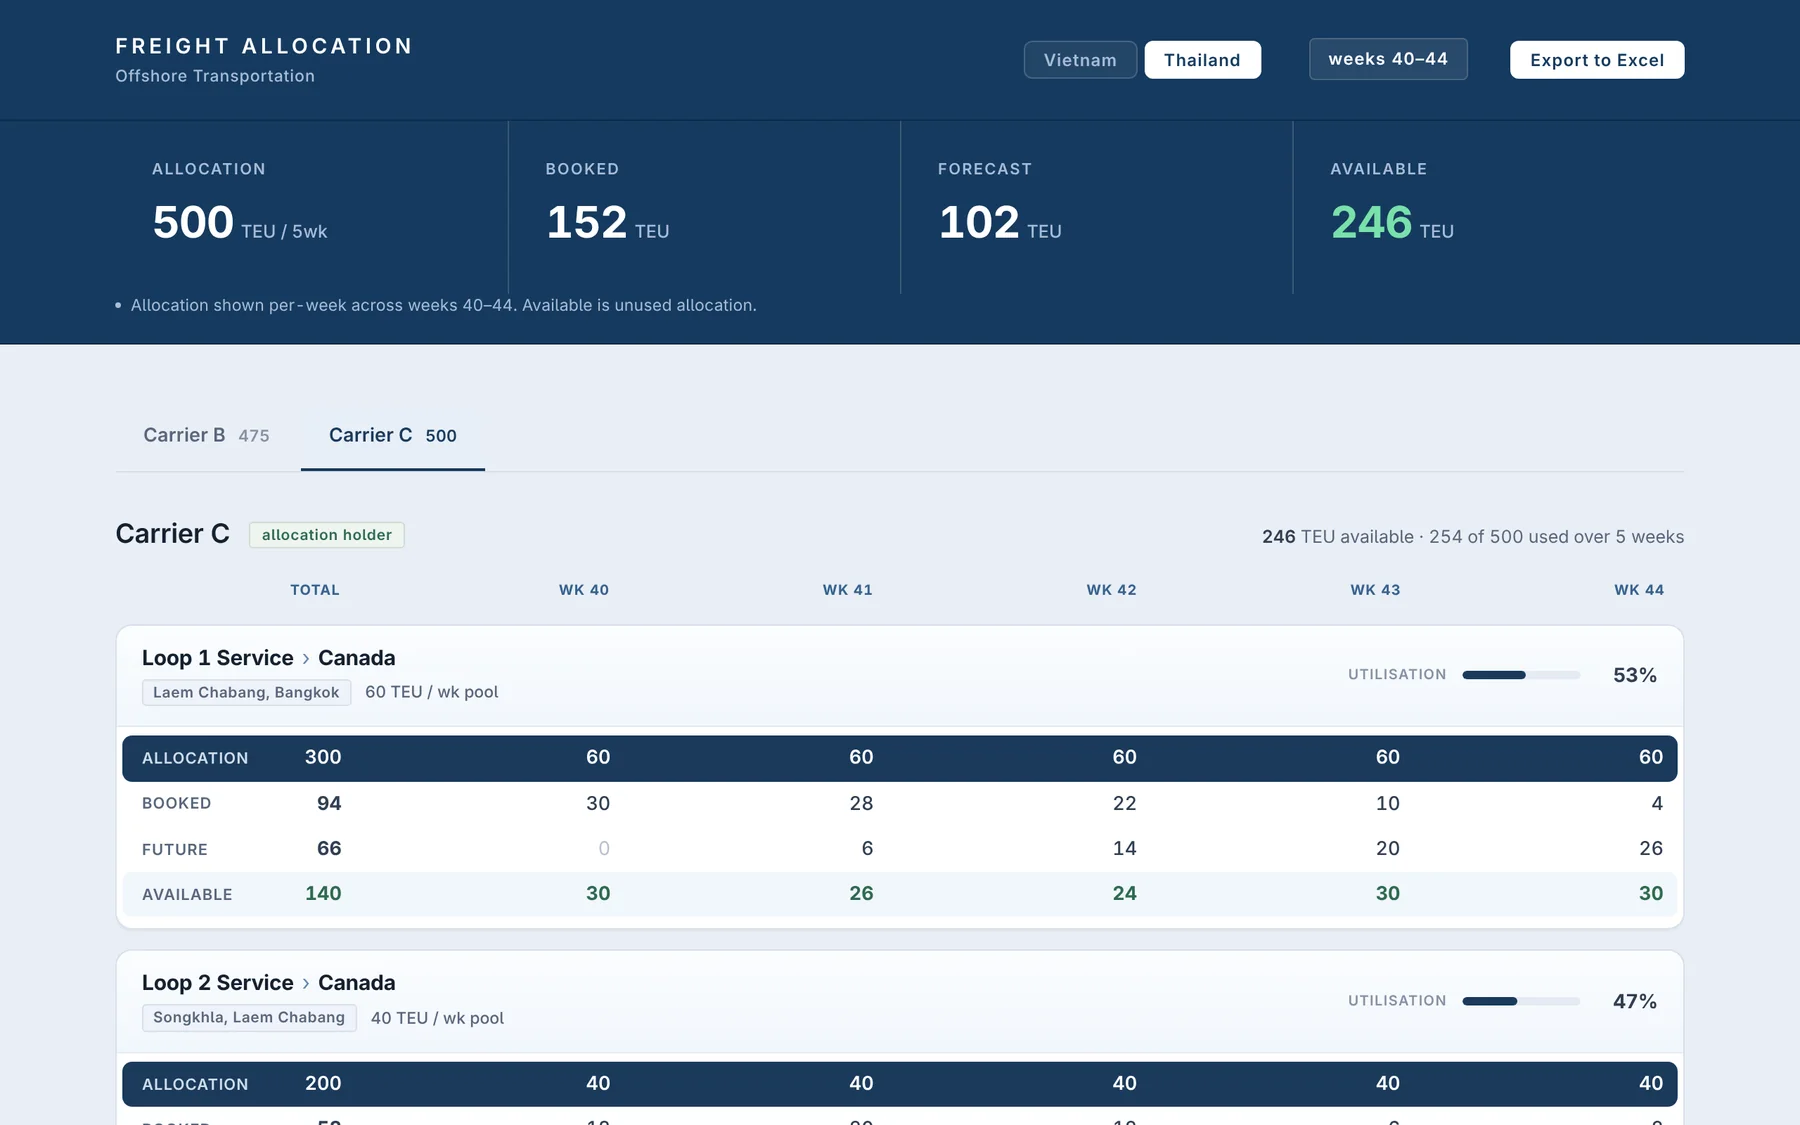
The contract said one thing, the weekly forecast said another, and nothing put them side by side. I built a single-file browser tool: drop in the forecast workbook and every lane shows allocation, booked, forecast and available, week by week.
Ocean contracts award space by carrier and by lane. Those numbers sat on a cheat sheet where the master grid was a pasted image, not cells, so nothing could read it. Booked and forecast volume sat in a separate weekly workbook. The question was simple: on this lane, in this week, how much contracted space is still open? Answering it meant reading a picture and cross-checking a workbook.
Available space is the number people act on, and a total hides it, because a quiet week can net out a heavy one. The first run against real data made that plain: several lanes were already over-booked against allocation, and now they showed up in red instead of staying buried in two files.
Screens below use demo data. Carriers, lanes and volumes are fictional.
An early version compared the whole period against allocation. It moved to week columns because a lane can be fine across five weeks and over-booked in one of them, and that one week is the problem someone has to solve.
Allocation belongs to the carrier holding the contract, so booked and forecast volume on an allocated lane counts against it no matter which carrier physically carried it. The question is how much of the lane is used, not who used it.
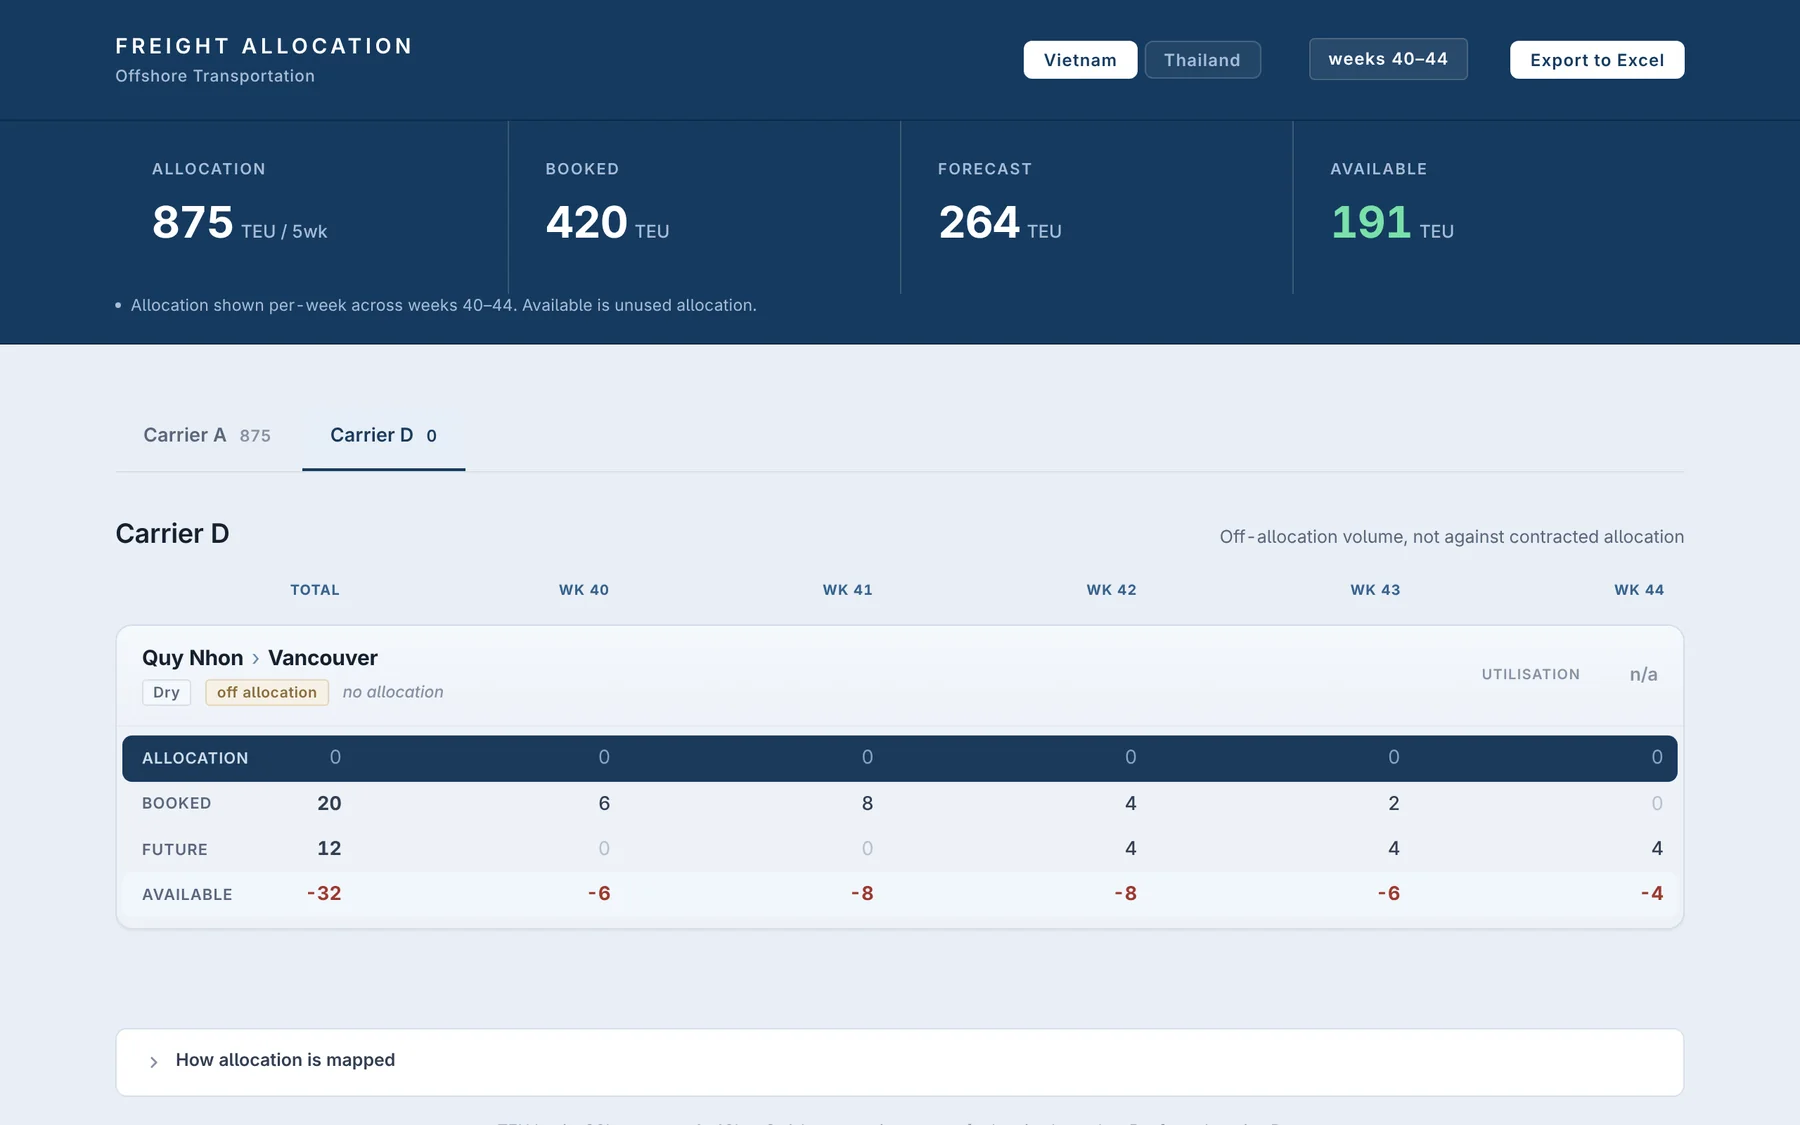
Volume with no allocation row could have been dropped or rolled into a total. Instead it stays visible on its own tab and never reduces what's available, so nothing goes missing and nothing flatters the number.
Allocation sits in one plain data file, so updating a number doesn't mean touching the tool. The source grid is an image, so those numbers are transcribed deliberately rather than parsed and hoped for.
The workbook is parsed in the browser and the Excel export is built there too. Nothing to host, nothing to install, and forecast data stays on the machine it was opened on.
Sheets are found by name, weeks come from a week column or get derived from a date, and port names are matched across files. A May to April file still sorts in order across the year boundary.
Built for the offshore transportation team and extended region by region. It covers two regions and both contract shapes today, with an Excel export of summary, lane totals and weekly detail across all of them.
A companion tool turns the same forecast workbook into one Excel report per carrier, with total, secured and forecast tabs and a bulk zip download. What I would build next is the remaining regions, each with its own allocation holder.
Stack: JavaScript · SheetJS · one HTML file